

Monday, December 13, 2010
Japanese Banks will run!!
MTU - Downtrendline Broken to Upside. Looks to be a good 6 month trade. Japan's banking system is awakening.

Sunday, December 12, 2010
Bronco Drilling - EMA Crossover - Bullish
The easiest trades are usually the ones with the easily identifiable bullish patterns, and nothing is more bullish than the EMA crossover.


Thursday, December 2, 2010
Is the Nasdaq headed for 3500?
Markets do things often not expected. There are many reasons for the market to go down today, and very little reasons to argue for it to go up. Although I believe the DJIA and SPX are probably near relative values over a 2-3yr period, I don't believe the Nasdaq can be stopped from now until then.
Based on the possible cup and handle formation in the Nasdaq, and its related calculations in its pattern, the Nasdaq may be heading to 3500 in the next 2 years. Yes, I said it, and Ill say it again - 3500 in the next 2 yrs. I'm not going to get wordy, and self indulgent in all the reasons it can, and can't, but rather point to the technical formation and its possibilities. If the handle breaks down, put a stop loss at 2200 and reevaluate your portfolio.

SOX - Cup and Handle?

As a technical trader, I try not to listen to things that create to much murkiness to what the charts say. And with that said, you can either drink from the cup, or pass!
Tuesday, November 30, 2010
CDE - Breakout of Triangle - $30 price target.
CDE has been on a tear and looking to further its gains.


Wednesday, November 17, 2010
Strategy Update: SOX + MU + Elliott Wave Theory
Pollux Technicals- Strategy Update: SOX + MU + Elliott Wave
I first wrote about the PHLX Semiconductor comeback in 2008 in The Other Commodity post, when the SOX was all but forgotten, staggering around the global market, lost, since 2000, while the great commodity bull market of the new century was literally rising from the earths crust with buildings as tall and as high as we have seen - and it was happening fast. But again, the SOX was lost, meandering in over-capacity, falling prices, decreasing margins - you know, the usual suspects. Then the financial crisis took shape and commodities cracked, and so did the SOX, further falling, and aiming for levels not seen since 2003 and 1998 - it was a here we are again moment. And that was it, the same moment that made you feel like you had been there before was the same moment that would never be seen again.
And two years later, the SOX has climbed from 175(a 10yr low) to 400, a whopping 128%, while the CRB Index only rose 62.5%, going from 200 to a high of 320 early November. Now, while I believe the CRB can outperform medium to long term, now is the time to start thinking about entry strategies to get back into semi-stocks. I still believe we are in the midst of a secular shift in this sector - the premise being that Semiconductors are today where commodities were in 2003-2004, according to Elliot Wave. Look at the CRB below and what its WAVE 1 and WAVE 2 looked liked.
CRB Index - Emergence of the Bull.

Here is the SOX index, which is in a WAVE 2 correction, and entering a WAVE 3 - the longest wave of Elliott Wave theory.
SOX Index - Emergence of a Bull.

What are the factors driving the SOX?
Well, inflation is one of them(lower dollar), along with a consolidation in manufacturing and outright bankruptcies during the global crisis. Add that to demand globally, as the middle class continues to surface in emerging markets, which compensates the overcapacity issues, and there is a solid case for continued demand for electronics, and also alternative energies and its consumption of semiconductors. As the DRAM prices have stabilized over the past 2 years, we can see on the DRAM Exchange, that prices have retreated in the last couple of months, but have been on a rapid rise over the course of two years, bouncing hard off its 2008 historical lows. With the recent pullback in DRAM and FLASH prices, I believe that now is the time to start looking at semi-stocks again for the Long-Term - buy and forget about them mentality. You don't buy Semi stocks when DRAM/Flash drive prices are high, you buy them when they are low. I would start aggressively accumulating Semi-Stocks over the course of 1-3 months. According to the Elliot Wave Theory, the Wave 2 selling could be coming to an end.
I was bullish on Semi land up until Jan/February of 10, when I called for a 15%-25% correction in the blog posting Watching The Leaders For A Shift. It was also this time I grew a bit bearish on the market because Semiconductors are part of the leaders in the business cycle. I was then implementing a long late cycle/short early cycle stance for hedged protection in the The Exit Strategy post and so far the strategy has worked, as we have seen late cycle commodities moving higher while semis/banks have been lackluster, with downward pressure - and that why its time to get back to Semi land, searching for entry points.
Below is a chart of MU and an Elliot Wave analysis for re-entry into that stock - overall I would be patient and wait for strategic entries back into semi-conductors, but this is where the value could be hiding, and possibly even creating superior returns to commodities for the long-term. Knowing Semi's may be in the beginning of a secular bull market, a new hedge could emerge in using Gold as a short hedge. This though would require a bit more research, as for now the Gold bull is alive and well, and juniors still present undervalued opportunities. So for the long haul, we could be setting ourselves up for a Short Gold/Long Semi strategy, at some point, but I'm not about to go there just yet.

I will also include a Mean Reversion charting technique I use to give myself another form of methodology of where/when to enter into a position.

Why Semis? And why MU - besides the fact I like the way it trades and its large liquidity, it is easily to identify its pullbacks due to its very simplistic elliott wave formation. But also, as the dollar falls, our semiconductor products and pricing become more attractive, globally. As the dollar continues to fall, or even if it stabilizes, it will be a large factor in its global competitiveness. And in the end, Semiconductors are - The Other Commodity - and remember commodities make roads and buildings - chips make everything else.
SOX COMPONENTS
ALTR,AMD,ATHR,BRCM,CREE,CRUS,HITT,INTC,KLAC,LLTC,LRCX,SNDK,STM,TER,TXN,VECO,NVDA,MU,NSM,POWI,RBCN,STM.
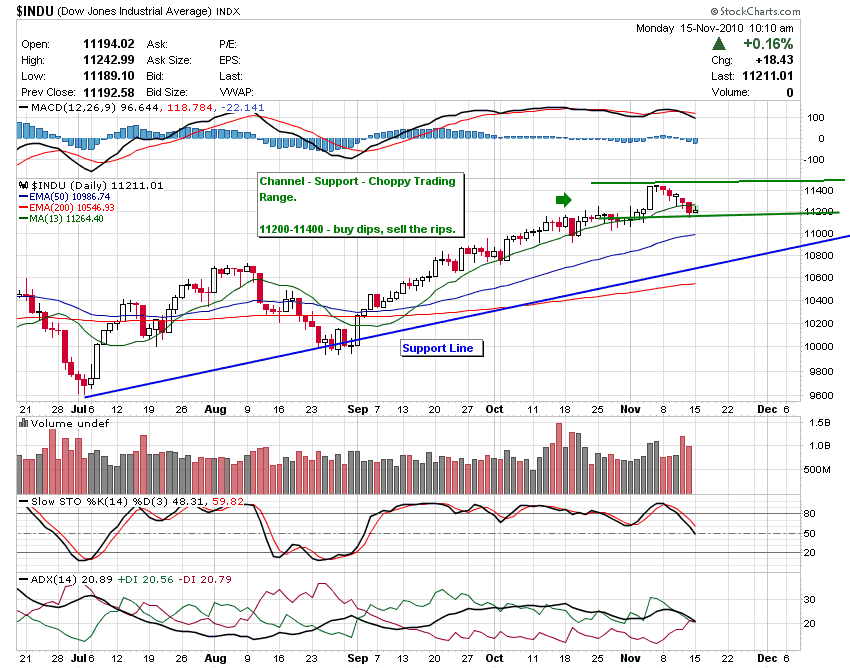
Monday, November 15, 2010
Market Stalls - Uptrend Still In Tact
The Dow Jones Industrial looked like it was going to rocket through its April/May resistance and send us in blow-off mode of some sort. That was all put by the wayside as many traders, hedge funds, algo funds, and even the small investor decided to take profits in the profit zone - meaning, anytime you come to resistance/support zones, there will be profit taking and volatility.
Looking at the DJIA and it's attempted breakout - it has now had a 5-6 day stall/correction. If we notice the large candle that gave us a signal of breaking out, and then the retracement from that candle, all of the corrective prices within that candle range. This now means DJIA has a high probability of channeling in here, before making an attempt higher or testing the current uptrend support.

Its currently a traders market with a long bias!
Looking at the DJIA and it's attempted breakout - it has now had a 5-6 day stall/correction. If we notice the large candle that gave us a signal of breaking out, and then the retracement from that candle, all of the corrective prices within that candle range. This now means DJIA has a high probability of channeling in here, before making an attempt higher or testing the current uptrend support.
Its currently a traders market with a long bias!
Thursday, November 11, 2010
Bearish Rising Wedge - GLD Intraday
Bearish Rising Wedge - Intraday GLD alert! 132 Downside target.
The risk trade is to be outright long gold here. There is need to have a hedging technique because people forget that gold is sort of useless and can fall as fast, or faster than a hyped up multi-billion dollar, no reveune, no business model, 2000 tech stock IPO. I am still a believer in the Gold bull and don't believe it's over, but I also know and realize Gold is nothing more than a measure of global psychology - the adhesive to global economics. We all share it around our neck, on our fingers, or as keepsake tokens, or maybe you have a vault with some gold bar pyramid stacked in the corner, but in the end, when the global psychology changes toward it, it will fall and fast!

A gold correction can happen faster than any algorithm can chase it, watch!!
Tuesday, November 9, 2010
Bullish Engulfing Japanese Candlestick
Simple is easy - I like easy.

Here is a simple explanation of a Bullish Engulfing Japanese Candlestickpattern which is a reversal pattern - meaning a trend change. This is the DZZ - double short Gold ETF - it's a great hedge for anyone with positions in miners, tech stocks, etc. I don't believe Gold is hit its peak yet, but I do believe its corrections will become faster and more violent. Take the DZZ overnight with you for a good night sleep!

Here is a simple explanation of a Bullish Engulfing Japanese Candlestickpattern which is a reversal pattern - meaning a trend change. This is the DZZ - double short Gold ETF - it's a great hedge for anyone with positions in miners, tech stocks, etc. I don't believe Gold is hit its peak yet, but I do believe its corrections will become faster and more violent. Take the DZZ overnight with you for a good night sleep!
Saturday, November 6, 2010
AUY: A cup and handle filled with fundamentals.
With gold prices at record levels, and this new $1,000 gold quote largely accepted in the new world, AUY could be poised to make a run higher. Looking at the relative performance of the stock compared to other juniors such as KGC, AU, and GG, you can see AUY has lagged and stalled during these recent boom times in junior miners. It is showing some of the worst performance among some of it's equivalents.

3 Mines To Commence In 2012
A 3yr period of a stagnating bottom line may be about to change as Yamana plans for 3 mines to commence in 2012. The company currently produces around 1.1 million GEO's and expects that number to hover or slightly rise for 2011 as more efficiencies are constructed and worked through existing mines. It's what it expects to do in 2012 that matters - the company expects production to jump, reaching near 1.5 million GEO's by 2012 with the addition of 3 mines coming into production: C1 Santa Luz (Brazil), Mercedes (Mexico), Ernesto/Pau-Au-Pique (Brazil).
With an expected near 30% jump in production numbers coming in 12-16 months and we continue to see rising prices in gold, this makes a good case to own AUY for the long-term. Nothing has come online since 2009 in terms of Gold expansion, since the 20 month construction of Gualcamayo in Argentina. This 2012 production expansion means rising revenue. With the increase in projected gold production of 400,000 ounces, this adds nearly $500 million in revenue using an avg. price of $1,200 an ounce. This increases the current $1.4 billion in revenue(ttm) to $1.9 - 2 Billion in projected revenue, a near 35% jump in revenue.
BOOK VALUE
If we look at a simple Book Value comparison in a couple of the junior miners, we can see AUY trades at 1.22 Price to Book almost book value as of today. With GG and KGC trading at 2 and 2.23 Price to Book respectively, AUY could almost double to get where KGC and GG are trading. And to reach the relative Price to Book of AU and IVN, AUY would have to rise 2-3x in price.
BOOK VALUE COMPARISON
The Book Value and Price To Book value are telling you that AUY is undervalued and could be headed higher. Base on a possible technical formation called the Cup and Handle AUY could be headed for $15 dollars in the near term, and if we valued it at a Price to Book of 2, we'd be trading around 18. And if the market valued AUY according to an AU and IVN book value, AUY would be in the 30's, heading to $40.

The technical formation above is a continuation pattern. The trend has been up, but stalled in the past 3 years as Yamana focused on integrating new efficiencies in production, rather than new production. Now Yaman is ready to ramp up production and the last time they did this, AUY went from $2 to a high near $18 dollars from 2005 - 2008. With gold prices elevated, production getting set to rise, a book value that may be lagging its coming rising production, Yamana is set to run and possibly even jump a few times also.
Friday, October 29, 2010
Gold will correct - miners show outperformance.
I was cleaning out my 90 different charts I have annotated because I became unorganized in my research which ultimately creates sloppiness in my work. As I was deleting unwanted charts, I stumbled on a chart of the GLD and noticed some advice I posted on my blog more than a year ago. It was about a $1,300 dollar price target on Gold and around a 130 price target for the GLD. Although I believe we still have more upside to finally reach the 12th round of this Gold vs. The World grapple match, I will take my own advice and call this current move complete and will assume a consolidation for 6-9 months .
I first analyzed the chart below in the blog post Assessing The Gold Breakout - in the article I pointed out some guidelines of technical analysis for determining price targets on some of the different type of potential pattern breakouts that were occurring in Gold and the GLD.
This chart is from that blog on the gold breakout in August of 2009.
.png)
This is the same chart with time elapsed to present.

Basically, the price target I was predicting is here - 1300 - and the current Gold trade is finished for now. If we see more upside momentum, it will be short lived IMO. Although Gold is overdone on the long side, the new price levels in which Gold will consolidate are now higher than that of the last two years. This means volatility in the price itself which translates into smaller margins for the Large Cap miners. For the junior miners, small-cap and exploration companies, this means their growth potential and margin potential will continue to shift in the right direction - especially miners with rising production numbers.
The below chart is the Junior Miner Index - Market Vectors Junior Gold Mine - which is outperforming Gold and the Large Cap Miners in the GDX. This means finding the right mining stocks, specifically ones with growth and rising production will pay off medium-long term.

The Gold bull remains but a short-term correction will occur and I will assume it will be faster, more violent than any correction to date in the current Gold Bull. It will also provide great trading opportunities, specifically on the volatility side. It's also a good time to start implementing any option/equity strategies to hedge your risk according to your market bias.
Thursday, July 15, 2010
Advanced Battery ABAT
Lets keep it simple: Advanced battery comes to huge inflexion point!
If that uptrend line is broken by more than 20%, bail. If it stays in tact, not breaking the -%20 percent loss from here than hold on to it because we could begin to see a large move coming.

Advanced Battery Technologies, Inc., through its subsidiaries, engages in the design, manufacture, and marketing of rechargeable polymer lithium-ion (PLI) batteries in the United States, Europe, and Asia. The company’s rechargeable PLI batteries are used in consumer products, such as portable computers, personal digital assistants, and cellular telephones. It also develops and manufactures various types of electric vehicles, including electric bicycles, electric scooters, and electric sports utility vehicles.
Monday, May 17, 2010
STOCK OF THE WEEK - OTE
Greece, Greece, go away, come again another day, Wall Street wants to play, Greece Greece go away.
CHANNEL BREAK - OTE Hellenic Telecommunication

CHANNEL BREAK - OTE Hellenic Telecommunication

Sunday, May 2, 2010
STOCK OF THE WEEK - COIN
Converted Organics COIN - Converted Organic Website
Here is a chart that shows some bottoming action, and also coincides with the theory that food/fertilizer/agriculture stocks will start outperforming for the summer since theoretically they are the last to move in the market cycle.
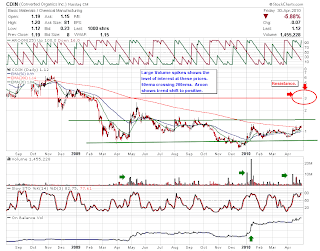
We may get some short term weakness as we look for continued volume increase here - more volatility before we see a large move to the upside. Let's protect ourselves with a stop loss placed right below the green support line. Long term bottoming action with a 3-5 month swing time on this one. Take profits at resistance, or at least sell half and re-evaluate. Good trading!!
Thursday, April 22, 2010
The Coming Spike?
Markets have been steadily climbing, without hesitation but does that mean we are do for a correction? Maybe, or are we about to just plow through any correction and blowoff the bull market in the coming weeks? Chart one shows the Elliot Wave Theory within a channel trend. The signals are pointing to a weakening pattern, but prices can still move higher as the technicals continue to weaken. The rising prices are unsustainable long-term, but in the short-term we can see a blowoff top that would signal the end of "The Great Bounce Of 09", so some strategic planning and execution are what matters - defining a plan is a must to reduce risk.

And what does a simple calculation from Technical Analysis 101 mean for the market? Based on the Head and Shoulders Pattern calculation[(neckline - head) + (neckline) = Target], so the target for the Dow is anywhere between 11500-12500 (see chart below) - I use this large area in the Dow loosely because anything is possible. This is where your execution and plan comes into affect - defining where you want to be for the next 6-9m is crucial in the coming weeks. Liquidation will occur in this area which will increase volatility - it's already showing signs in the VIX.

The only thing one can do is take a measured approach to your risk appetite. You can start to diversify out of stock and into cash or you could take on some hedges by going short the areas of the market which you believe will fall, faster and further, which would hopefully offset the losses from any part of the portfolio that is long. The coming week(s) are going to be one for the record books, again!
Good Trading!
Monday, March 15, 2010
STOCK OF THE WEEK - POTASH
It seems everyone has bought some POT in the past, well the time may have come to buy it again. A possible breakout is occurring on a gap up with large volume.


Saturday, March 13, 2010
Chasing The Lead Pack
The pack has formed, the Nikkei is setting the pace with the Nasdaq and its echo of pounding footsteps, close behind. Since the last post about the Nikkei's emergence in Comparing World Markets, the Nikkei has shown leadership during that time and is making a move to become the best large economy performer of 2010 so far. The long term charts for the Nasdaq and the Nikkei are best suited for a 3-5yr time frame to be long. There will be bumps, pullbacks and even some strong corrections, but a major(secular) shift is occurring. This also helps back up the theory - The Other Commodity - which has so far led many global markets out of the abyss.

.png)
The idea behind The Other Commodity and its relation to the Nikkei is that Japan is well regarded for it's technological advancements in semi-conductor manufacturing, optical segments, and most notably consumer electronics, although that has been waning in recent years(and decades) - known also for innovation financial services, which could also be starting it's new beginning. How? If China realizes that its internal financing economy can lead to risks down the road - why not just let your currency rise and start financing growth and reducing risk from Japan's financial institutions. Basically, spread the risk and a bit of the reward.
What we do know is that over the last 12 months, technology across the globe has shown relative strength in major markets across the globe and this could mean that Japan's Economy, especially if China let's the Yuan rise, will benefit most from the consumption of smaller, better gadgets in technology, worldwide - which may help Japan's consumer electronics industry to come out of hibernation.
Below is a chart showing the emergence of the Nikkei as the new leader in the short term. One great investment idea is to be long the EWJ. The idea is to be long until that trend line breaks. Also note that we are at the bottom of the channel so we are at a high-risk area, but also high reward. If the channel is true, then we can see a rise to the median and even upper channel trend.

Here is a list of mutual funds to hold long-term 3- 5yrs.
AIM JAPAN FUND
COMMONWEALTH JAPAN FUND
FIDELITY ADVISOR SER VIII FID A
FIDELITY JAPAN SMALL COMPANIES
HENDERSON JAPAN ASIA FOCUS FUND
HENNESSY SELECT SPARX JAPAN FUN
HENNESSY SELECT SPARX JAPAN FUN
HENNESSY SELECT SPARX JAPAN SMA
The basic premise of the research is that the Nikkei is poised to outperform most all other markets, even if they go down, the Nikkei is likely not to go down as much, and if they go up, The Nikkei is poised to go up more. 頑張って (Good luck!)
Tuesday, February 16, 2010
JASO the bull!!!!
Stock of the Week - JA Solar Holdings, Co., Ltd.(NasdaqGS: JASO)
Many indicators of why this channel is working - look at all the buy and sell signals on the Stochastic. Great Channel with lots of potential - "the trend is your friend".

Many indicators of why this channel is working - look at all the buy and sell signals on the Stochastic. Great Channel with lots of potential - "the trend is your friend".

Saturday, January 30, 2010
COMPARING WORLD MARKETS - FINDING THE NEXT LEADER!!
Looking at a 3 month and 6 month relative pricing chart, you can see the Hang Seng is the worst performing and has been drifting lower, under-performing all other markets on a 3 month and 6 month basis.
3M - Relative Performance

6M - Relative Performance

What is also interesting is that the Nikkei has been lagging right behind the Hang Seng, but on a 3 month basis the Nikkei experienced a negative 20-22% performance spread against the Brazilian Bovespa shrink, from Nov to today, to a negative 7-8% spread vs that same market. This means the Nikkei outperformed by 12-14% from that spread low. You'll also notice the negative Nikkei spreads disappear vs. world markets on a 3 month basis.
This means a long/short strategy is emerging. If you would have been long the Nikkei futures, and Short the Bovespa futures, you would have experienced a risk adjusted net gain due to the squeezing of the spread. Going forward, I believe, you can still implement such strategy if your risk appetite allows.
Can the Nikkei takeover world leadership long-term?
Let's look at the charts.
Here is a medium term chart showing a possible NIKKEI channel. We need to bounce here soon, but many indicators are supporting this rising channel.

10 Year Chart

There are many tell tale signs that the Nikkei may enjoy some leadership going forward. Their markets have consolidated their massive excessive bubble's for 20yrs. The US markets have now been in a 10yr consolidation phase - maybe another 10 before we actually bottom, who knows. But one thing is for sure, nothing is certain, not even the certainty that the Nikkei is poised for leadership.
Tuesday, January 26, 2010
Japan Downgraded - Time to Buy!
S&P downgrades Japan - Why this is a time to buy!
Moody's and The Bovespa - 2002
Brazil almost went bankrupt in 2002. In 2002, many of the international financial agencies were downgrading Brazil in many ways - many blamed the debt uncertainty because of a socialist/leftist candidate named Lula da Silva and the possible negative economic implications if he were to win the election - well he did win and so did Brazil.
Article: Moody's Downgrades Brazil Debt Article.
And this is what the stock market did after the debt downgrade and the election of a socialist.

Today: S & P and Japan!!
S & P downgrades Japan's Credit Rating Article.
Here is a chart of the Nikkei 20yr.

The Nikkei has been drifting lower for twenty years - the chart looks to have double bottomed and this could be a place to park some cash as markets around the world continue their correction. Let's see where the Nikkei is 3-5 years relative to world indices. Here are some charts of MTU, MFG, and NMR.
Note of warning: when these type of media events take place, the volatility will naturally increase so expect some "whipsaw" action.
NMR

MFG

MTU

Use any weakness to start accumulating Japanese banking stocks and any other stocks that have good technical signals. I will now scour Japanese stocks for new bargains, etc. This will be a volatile time so manage and strategize your approach.
Tuesday, January 19, 2010
GA - Giant Interactive - Chart Of The Week.
Giant Interactive is a online gaming company in China. Notice how there has been a sort of flat line to the MACDs and even the price. But what is changing now is that the price is ever so slightly rising relative to its 50d EMA(exponential moving average). ADX trend indicator has also shown signs of shifting. Stochastic popped into positive territory and looks like it could stay there. If the trend is shifting, it is strategic to get in while the beta is low, and you have a slight rise to the price relative to its MA's - you can get 5% without any notice.

Risk Management:
Sell if the short term uptrend line is broken.


Risk Management:
Sell if the short term uptrend line is broken.

Thursday, January 14, 2010
Chart of the Week - CHANNEL BREAK
Central Pacific Financial Corp. (CPF) has broken it's bottom channel line which is a trend reversal concept. Watch for the development of a new channel and its transgression lines.
From Online Trading Concepts
Trend Reversals
When price closes outside of the Linear Regression Channel for long periods of time, this is often interpreted as an early signal that the past price trend may be breaking and a significant reversal might be near.
Linear Regression Channels are quite useful technical analysis charting tools. In addition to identifying trends and trend direction, the use of standard deviation gives traders ideas as to when prices are becoming overbought or oversold relative to the long term trend.

According to the concept, a new uptrend should begin. I guess only time will tell.
Sunday, January 10, 2010
Chart of the Week (and decade)
Mitsubishi UFJ Financial Group, Inc. (MTU)
I first found the idea of Japanese banks as a good bet for 2010 from the blog THE OIL TRADERS BLOG. I then delved into some charts and found the technicals to be quite impressive. I decided to post this one as the "Chart of the Week or(more like decade) which shows a massive possible trend change. It all makes sense in the respect that the Japanese Banking Crisis happened in the late 80's early 90's. Our banks dominated the last 20 years and arguably longer but the tides may have shifted and put Japan's financing in the lead going forward - we'll see.
Here is a chart of Mitsubishi UFJ Financial Group, Inc. MTU which shows a massive Long Term trend shift in the form of a Head and Shoulders bottom.

Other tickers he mentions are MFG, NMR.
Thursday, January 7, 2010
AUY vs. MU
Here is a view of why the short early cycle/long late cycle may be quite profitable in the short term and also give you a bit of downside protection.
AUY Channel
The objective is to expect a bounce to the median channel and even the upper band. Watch for breakdown at support channel. If it breaks, strategy will have to be re-evaluated.

MU Channel
*Notice it is in the median of its channel - it can still thrust to that upper channel and then create the downside correction/consolidation period.

The looming risk in this trade is if AUY breaks down at trendline(it can happen) and MU keeps going - that would hurt, but worth the risk.
Tuesday, January 5, 2010
Watching the leaders for "The Shift"
I first wrote about the coming secular bull market in the semiconductor space in the 2008 article THE OTHER COMMODITY. In it was the first pitch on the idea that a secular shift was occurring in the Semiconductor space, and more specifically the Philadelphia semiconductor index (^SOXX).
Well, almost 2 years have passed since that article and we are still showing signs that this huge turn could be manifesting, although the first purge may be coming to an end.
In this article I will demonstrate that the current bull move for the Philadelphia Semiconductor Index could be coming to a end and a medium-term corrective trend could begin - meaning we could see a 6-9m downward consolidation phase.
Is the bull alive and well in Semi land? - Yes, by all means this is just the first pitstop where one should protect profits, scale back, and even use this current move to add to the strategy of long late cycles, like energy and gold, and short early cycles such as Semi's.
Here are a few charts to contemplate this theory that we may get a 15-25% correction in Semi stocks soon.
Semi Index hit my resistance zone and is showing what could be a Long Term WAVE 1 completion, with a corrective WAVE 2 coming, of ELLIOT WAVE THEORY.

I like MU as the best overall technical play. I posted about the CHANNEL BREAK below which showed the reversal of that trend.

But things are shifting, and I am now looking what could be the completing of a WAVE 5 count. This coincides with the Semi Index completing the WAVE 1 of the index above.

In essence, the current move off the bottom could be coming to completion. At what price this happens is still up in the air as these type of capitulation things can go farther, faster than you think, but over the next 6-9months, prices will be at best flat in this space, and probably experience a 15-25% correction.
This would bode well for a short early cycle/long late cycle risk adjusted strategy. This by no means means the end of the secular trend is over, but rather if you want to try and time the market, this is a place to try.
Always enter at your own risk, but with MU up almost 250%, I'll take those chances.
Sunday, January 3, 2010
Chart of The Week
L-1 Identity Solutions Inc. (ID)
TIMEFRAME (3-6weeks) Target $8.50 - $9.50

Stop Loss at Trendline.
TIMEFRAME (3-6weeks) Target $8.50 - $9.50

Stop Loss at Trendline.
For the New Year! Happy 2010!
Happy 2010! After quite the year, not to mention decade, for the markets, Pollux Technicals would like to note some changes to the format styling this year.
CHANGES for 2010
1. I will now post a weekly stockpick type of blog - I will name it something later.
2. I will be setting up a twitter account for more realtime thoughts and updates, current momentum plays, and general market stuff.twitter.com/Pollux Technicals
3. I will add a montly analysis of a different world market.
4. I have also started a Facebook group - Become a fan!! Pollux Technicals
There may be more changes to come.
Pollux (β Gem / β Geminorum / Beta Geminorum) is an orange giant star approximately 34 light-years from the Earth in the constellation of Gemini (the Twins). Pollux is the brightest star in the constellation, brighter than Castor (Alpha Geminorum). As of 2006[update], Pollux was confirmed to have an extrasolar planet orbiting it.
The name Pollux refers specifically to Castor and Pollux, the sons of Leda.[1] The star also bears Arabic name Al-Ras al-Tau'am al-Mu'akhar,(الرأس التؤام المؤخر), literally, 'The Head of the Second Twin.' Historically, the Chinese recognized Pollux as Yang, which in ancient philosophy was one of the two fundamental principles upon which all things depend. Castor and Pollux together correspond to the Nakshatra Punarvasu in Hindu astronomy.
Castor and Pollux are the two 'heavenly twin' stars giving the constellation Gemini (Latin, 'the twins') its name. The stars, however, are nothing alike. Castor is a complex sextuple system comprised of hot, bluish-white A-type stars and dim red dwarfs, while Pollux is a single, cooler yellow-orange giant. The name is traditionally thought by some people[who?] to carry the meaning 'much wine,' since astrologers associate Pollux with prosperity and celebration with wine
Subscribe to:
Posts (Atom)