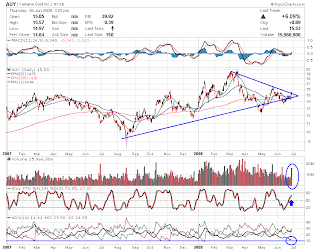

Parallel World.
I would short the first chart and buy the second chart, but the reality is that they are the same chart just flipped - this was done in photoshop. This gives you a context of what it would look like if the price was going the other way.
3 Technicals for the 2nd chart:
RSI hitting bottom and deeply penetrated.
AROON about to shift.
MACD's hitting bottom - which has been a good indicator for a bounce.
BOLLINGER BANDS are showing the stock is oversold and a move back to "normal" 6.44 is due - its the neutrality of the technical mechanism. Also, look how far we have strayed from the Moving Averages. If we live in a parallel universe, and SIL was rising this fast, a short trade would be in order. The prices can not move that far away from MA's - in a normal scenario. The green box is the price target.
Developed by John Bollinger, Bollinger Bands are an indicator that allows users to compare
volatility and relative price levels over a period time. The indicator consists of three bands designed to encompass the majority of a security's price action.
A simple
moving average in the middle
An upper band (SMA plus 2 standard deviations)
A lower band (SMA minus 2 standard deviations)
Standard deviation is a statistical unit of measure that provides a good assessment of a price plot's volatility. Using the standard deviation ensures that the bands will react quickly to price movements and reflect periods of high and low volatility. Sharp price increases (or decreases), and hence volatility, will lead to a widening of the bands.
Bollinger Band Targets.
1st target $6.44
Second target $8.33


