Thursday, June 26, 2008

UNG - Throwback in process.


A throwback is occuring. Use this as an opportunity to scoop up cheap stock. Green box is accumulation area.


THROWBACK - A price move back toward the entry level of a security that has broken beyond the barrier of a price pattern or trendline. The retreat toward the level of the breakout is not uncommon and is used by many traders to confirm the validity of the new momentum.

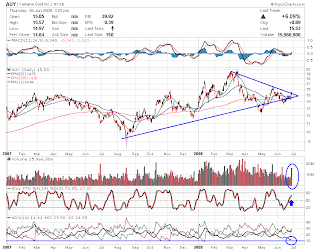
AUY - Triangle Breakout - BUY


Look at the technicals - they are shifting. Gap open today. Momentum is up and fast.

Wednesday, June 25, 2008

FCX and PCU


Positive Technicals for PCU and FCX. Watch for volume to increase for confirmation of more upside trending. Watch copper prices trying to break out of its consolidation for more ammunition to get bigger and longer.


Coal Stocks - MEE, CNX, ACI - Short-Term Negative


Coal Stocks - Short -Term Negative.

Time frame 4-8 weeks, although we saw some of that action occur today, so the time fram may actually be shorter.

Coal stocks have had great runs, and I don't believe the commodity top has burst yet - not by a long shot - but at this point we need the technicals to take a breather and that means corrections are sometimes in order.

I added three charts on MEE, CNX, ACI, and notations of some negatives which would make the case for a short sell. The most bearish going from top to bottom. Pollux Technicals believes this is just a correction that needs to occur in order to support longer term prices. The technicals are looking overbought, but it's waiting for the correction to occur that will be the bigger challenge. These are by no means the long-researched, balance sheet dug type of all out short, but rather a move back to neutral that can be exploited.
Take the profits when they hit - anywhere between 7-10% corrections should be strategically removed - meaning take 2/3 off at the 7-10% correction and another 1/3 off if it hits 10-12% correction.
Stop-Loss Targets:
ACI 77.10
MEE 96.10
CNX 121.10

Monday, June 23, 2008

SIL - Strong Buy


Parallel World.


I would short the first chart and buy the second chart, but the reality is that they are the same chart just flipped - this was done in photoshop. This gives you a context of what it would look like if the price was going the other way.

3 Technicals for the 2nd chart:


RSI hitting bottom and deeply penetrated.
AROON about to shift.
MACD's hitting bottom - which has been a good indicator for a bounce.


BOLLINGER BANDS are showing the stock is oversold and a move back to "normal" 6.44 is due - its the neutrality of the technical mechanism. Also, look how far we have strayed from the Moving Averages. If we live in a parallel universe, and SIL was rising this fast, a short trade would be in order. The prices can not move that far away from MA's - in a normal scenario. The green box is the price target.


Developed by John Bollinger, Bollinger Bands are an indicator that allows users to compare volatility and relative price levels over a period time. The indicator consists of three bands designed to encompass the majority of a security's price action.
A simple moving average in the middle
An upper band (SMA plus 2 standard deviations)
A lower band (SMA minus 2 standard deviations)
Standard deviation is a statistical unit of measure that provides a good assessment of a price plot's volatility. Using the standard deviation ensures that the bands will react quickly to price movements and reflect periods of high and low volatility. Sharp price increases (or decreases), and hence volatility, will lead to a widening of the bands.


Bollinger Band Targets.

1st target $6.44

Second target $8.33

Sunday, June 22, 2008

Copper - Strong Buy


I've been updating charts on copper for some time now - we had an attempt to breakout on copper prices at the beginning of the year, but we quickly sold off from that level, even as copper inventories stayed low. With the recent activity and technical changes, Copper could be once again attempting at the resistance line.


The two charts are different time frames. The longer time frame shows that we could still have prices falling to 325-350 area, but with the technical landscape changing, it is looking less and less likely. The recent action suggests buying from overseas again as the emerging economies are holding up better than the US. As long as Copper inventories stay as low as the charts show, that means, according to Econ 101, that the supply/demand picture supports higher prices.


**Notice the ADX indicator on the shorter time frame which has recently hit bottom - this has shown great buy signals in the past.
I would put a plan into place to go long copper equities, and even start accumulating large portions of the junior miners because their reserves will now start to be noticed by the large caps, even if they are not mining those reserves. The large caps will start to use their cash by gobbling up the juniors and turn those reserves in revenue. We'll look for some juniors this week and post an analysis on a couple.


COW - Livestock Total Return - BUY.


Wouldn't you know it - meat prices are rising.


COW - yes, that's right - is trending higher and everyone wants a piece of it. Volume is increasing substantially here and it has carved itself out since the IPO price. I would look for first resistance at 47 and then the breakout point at 50. The only indicator I'm really looking at here is the MACD's(Moving Average Convergence/Divergence), a stocks momentum, which has shown some positive divergence as is seen with the peeling away of the indicator(Bullish Crossover).


This analysis is truly only a momentum play - a special situation if you will. IPO's have no track record so it can be a dangerous play because if we believe in Technical Analysis - which is the reading of the overall condition of the stocks past performance relative to the future performance, well IPO's don't have any history from which to track. During "mania's" IPO's are nothing more than momentum plays - pure and simple - yes, occasionally you get a GOOG, but for the most part these stocks are meant for short term traders so, buyers beware.