Tuesday, December 30, 2008

Assessing Breadth.


For many technicians, breadth indicators are key in confirming new uptrends or downtrends. If we look at the New Highs(end of day) to New Lows(eod) for the markets - this is nothing more the stocks making new highs(or lows) vs. the reciprocate - we can see favorable developments that confirma the market bottom is in. For instance, in the Nasdaq chart, we saw 1,600 new lows develop in October, but only saw 1100 new lows develop in November even as the market made new lows - stocks making new lows decreased from the October plunge to the November low. The same holds true for the NYSE which saw a positive divergence from the October plunge to the final low in November - 2400 to 1000 respectively.

The question now is what kind of reciprocate numbers can we see on the upside. How many new highs will be made on a market rally? Only time will tell, but there will be clues, you just have to quantify them.


Sunday, November 23, 2008

Was the market bottom on friday?


I last updated a chart of the DJIA related to the VIX and the targets were hit - 9500 on the DJIA and the 50 support on the VIX. From there we saw some more volatility to the downside, but things have shifted once again. Look at the stochastic bouncing on the topside of the downward trendline from before. The VIX ROC is falling and the stochastic is crossing its %D negatively. And if we look at the ADX, the attempt at a breakout has not been confirmed with the ADX which made a lower divergence. Also, look at the volume - it is entering a new phase and produced one of the most powerful volume days yet! As for the bottom? - Only time can tell now.

Thursday, October 30, 2008

Why the market bounce is for real!


After a violent and destructive thrust through the overhead resistance/ceiling of what "normal" used to mean on the VIX, The CBOE Volatility Index® (VIX®), we may now see momentum waning and a corrective course taking place. Look at the stochastic pulling a negative divergence on the recent high, the ROC(Rate Of Change) Indicator is falling and the ADX(trending indicator) looks like it has peaked - all for the meantime.


Lets look at the 50 as a short-term support and a possible intermediate trend downward back to the 35-40 area. The bigger question then remains if the VIX has now entered a new "era" where we will gauge market sentiment in between 30's and 80's, which would also mean more volatility. If this new era of the VIX does hold, then it will be a traders market with mini bulls, something that would resemble a channeling market. Or is this the ever so slow bleeding of the VIX back down to the 10 area? I guess you'd have to stick around for that one because its a long way off from here, but possible.


Let's now concentrate on the VIX short-term support zone(50's) and near-term zone of (35-40). This could act as correlation zones with the DJIA overhead resistances. I would equate the test of the 50 support area on the VIX with the DJIA 9500 overhead resistance. The 40 support area of VIX would correlate with the DJIA overhead resistance of 10500 - thats where the VIX broke the overhead resistance in late Sept/early Oct and the market crashed - yes, that was a crash.

Friday, October 3, 2008

Inflation and Deflation(Commodites vs Semis).


My assumption still stands: Semi's will outperform over near term and long term. Below is a chart comparing the Dow Jones-AIG Commodity Index (DJI) vs. PHLX SEMICONDUCTOR SECTOR INDEX (SOXX).


Notice the difference over the last 5 years: inflation was beneficial to commodities, while it hindered any sort of bull market for semiconductors. We have seen commodites prices ease(deflate) these last couple of months, and that means we are deflationary and Semis will counter - the next cyclical turn will have semis leading as deflation sticks around and commodities consolidate in its secular trend. This does not mean commodities will completely lag, but rather Semis should outperform in the cyclical trend, while underperforming on the secular trend.


You can view the full analysis blog called "The other Commodity" here.


A short term triangle has formed on MU with good volume. Trade the bounces while keeping a long term position on hand.


Thursday, October 2, 2008

The AIG triangle and Gap Fill


Target 10.00.

Stop-Loss 2.50
Risk with stop loss = - 40%
Profit Possibilities = +100%


Monday, August 11, 2008

What's the story? UNG vs. Natural Gas


Technically Examining: UNG vs. Natural Gas

If we look at both charts we can first see that the commodity itself is volatile in nature. The UNG or Natural Gas itself shows an extreme amount of volatility vs. things like GLD, USO, SLV, etc.

The best way for individuals to connect their investments directly to the price of natural gas, or other commodities, is to buy the ETF - a byproduct of the price itself that has been created by leading investment banks. The UNG was recently IPO'd last year and this is where technical analysis becomes fragile due to the nonexistence, or minimal existence of a "history" from which a technical analyst would draw from. At the current moment, the technicals on UNG have been decimated and will be volatile near term, and in corrective mode for medium to long term (6m-1y). One thing for sure about UNG is that the volume has entered a new phase of open interest which means more and more are flocking to this investment tool.

If we now center our attention on Natural Gas prices themselves, we can see more of a "historic" presence that exists. The recent move of natural gas from 5.5ish in the middle of 07 to 13.5ish just a couple of weeks ago is a 120%+ return, which is not bad for a commodity in such a short time. This correction still puts Natural Gas prices with a respectable 40%+ return from its low of 07.


Fundamental Difference.


One thing to examine is why natural gas itself is not trading at all time highs vs. other commodites, oil in particular. Oil is widely more used than natural gas, and only recently in the last decade has natural gas been looked at as a highly viable alternative. This means that the infrastructure for Nat Gas is not as extensive as oils infrastructure and this has to do with oil's deep integration into our lives vs natural gas. You might think about using natural gas in your home, if its available, but not many would think about a natural gas car, motorcyle, or lawnmower, etc.. This is why the price itself is more volatile than oil, and other commodites. Oil is available in many more facets of our daily lives, but Natural Gas is still neither here nor there, but that is improving and should continue to stablize prices themselves - natural gas needs more infrastructure buildout so that when we make energy decisions, its available.


One conintinet that has a better natural gas infrastructure is Latin America, and most notably Brazils healthy appetite for natural gas as an alternative to oil. Due to the abundance of natural gas in the valleys and hills of Brazil, Argentina, Bolivia, etc., Latin America has diversified its energy habits to include natural gas and the infrastructure buildout is more advanced. There are many natural gas piplelines that exist and many that are in construction, with Bolivia being the most notable new entry into the natural gas pipeline game in Latin America.


From the technical standpoint on UNG, one would want to evaluate their timeframe. The IPO gives it less history from which to draw from. You should look at Natural Gas resistance and support levels to coordinate buy and sell signals on the UNG. Natural Gas has had trouble with the 13-15 area - it has encountered turbulence entering a new price level. It could be becuase natural gas is a consumer adoption choice vs oil which is a consumer oriented need - we use more oil in our daily lives than natural gas. If we continue to see increased adoption and further penetration into oils consumer market share, then prices should break above that ever elusive 13-15 area. Until then, expect more volatility.


UNG

1m-3m: prices could see 50 but that is also resistance.
3m-6m: prices could see the a breaking of the 50 mark and enter new trading range.
1y+: prices could see natural gas moving towards highs.


Tuesday, July 22, 2008

EWJ - Going Long Japan.


ISHARE MSCI JAPAN IN(NYSEArca: EWJ) - BUY


TimeFrame - Long Term(1-3yrs)
Low Risk and Low Beta

1st Target: < 6months - $13.50
2nd Target: 6 -15 months - $15
3rd Target: 1-3yrs - $19

The EWJ is showing a recent consolidation pattern that may be nearing an end. There are 2 charts: a daily and a weekly. The weekly trendline is being tested in the first chart. The 2nd chart shows a shorter time frame which suggests more volatility ahead but with MACD's testing the low again, the RED AROON extended on the corrective side of things, and the recent stochastic jump, we are seeing positive technical developments that suggests that EWJ is continuing to carve out a bottom. We do need to see volume confirm this, so watch for this in the coming weeks.


Breakdown target would be 10.50.


Friday, July 18, 2008

UNG - Throwback finds support.


UNG: Accumulate.


The first chart is a revised version of the ETF: UNG. The second chart is the first analysis that was formulated, and shows the beginning of the technical term "throwback". It looks as though it penetrated below the first support I had drawn and hit the 2nd support line - also its 200 EMA. UNG will likely bounce/consolidate for the rest of summer/year.
Look for the commodity complex for some of the best day trading setups going as the volatility has now increased on this correction. Play the patterns, which there tend to be many triangles in the commodity world, but technical analysis has to be malleable in some form, so when you're looking for one thing, it's always another. This correction is better for the overall long term pricing of commodities and will create the base from which prices will go higher. UNG is now in accumulation.

Friday, July 11, 2008

Why the NASDAQ stands on firmer ground!


Long-Term Trend Analysis

NASDAQ vs. DJIA
Timeframe (1-3 years) NASDAQ outperforms.

The Nasdaq has held onto the march lows so far while the DJIA has broken through its support. What are the charts saying? It says the NASDAQ is still the top of the competition in the global world, while the DJIA may just be losing its competitve edge all together. After the NASDAQ's high flying bust from 5,048.62 in the year 2000, the Nasdaq, now 8 years later, is only sitting at 2257, which is a good 50% away from its peak. As our banking system, our consumer, our auto giants, and many other moving economic parts settle into the new paradigm of globalization, the DJIA will have a tougher time because it has lost its competitive edge as the "father" of world markets, and now is heading towards the "grandfather" of world markets, while the technology heavy NASDAQ is still the blueprint for modernizing economies and is passing the test here.
As we look at what the chart and this recent breakdown of the DJIA vs the NASDAQ holding onto its support, the NASDAQ could now be the one to lead. It's proven that it does not want to go below the March lows, so far, while the DJIA has already penetrated through these levels. Thats why the Nasdaq will outperform relative to the DJIA going forward. This also holds well to the SOXX - PHLX SEMICONDUCTOR SECTOR INDEX theory I posted about earlier in the year.

Thursday, July 10, 2008

FCX vs. CHK - Breakout Backtesting.


CHESAPEAKE ENERGY CP(NYSE: CHK)

&

FREEPORT MCMORAN B(NYSE: FCX)


Above is a chart of CHK at the beginning of the 08 and after an almost 2 year consolidation. If we look we can see that the "headfake" or sometimes known as"search and destroy" techniques, took affect on CHK before it's rocketing breakout move.


The first chart shows what it looked like and the 2nd chart shows where CHK went after the headfake and breakout.


I am looking at FCX in the same respect here, as of today. Sure, we could break down and I would put a sell-stop at 98.50 for that, but we could also be seeing the same thing that happened to CHK in the beginning of the year happen with FCX.


CHK made a move back to the 200 EMA at tested the main trendline and as you can see by the 2nd chart, and FCX is doing nearly the same thing. This also means the degree of the trend angle could be shifting higher, meaning the trendline is steepening.

Tuesday, July 8, 2008

VIX - 1st Resistance - Quad Strategy Holding.


Market bounce is more probable as the VIX and DJIA will show - not too mention we have oil prices falling.

This is the first resistance for VIX. We could fall off resistance and market bounces aggressively, or we still penetrate through to the dotted blue line. Either way we are entering convergence of DJIA and VIX - look at the 1/2 Quad Strategy and the VIX resistance.

FCX testing trendline.


FCX Freeport-McMoRan Copper & Gold Inc. is testing a intermediate trendline. If we get a "hammer" candlestick on 20 million+ volume then we go higher, if not we have to respect the sell-stop at 98.50..


List of Candlestick Patterns.


NOTE: A trendline is only a trendline if it can touch 3 different points of reference. Two pointed trendlines are in fact not trendlines.

Monday, July 7, 2008

Coal Stocks - Take the Money and Run - MEE, ACI, CNX.


MASSEY ENERGY CO(NYSE: MEE)

ARCH COAL INC(NYSE: ACI)

CONS ENERGY INC(NYSE: CNX)
Original Analysis Below.
Profits of 12-15% + have been achieved since I posted to short these coal stocks. At these levels it is prudent to take the postion off. If you still feel they have more downside, then only stay short 25% of the original postion and cover the rest if you get a 5%+ more downside.
Overall the short swing worked and you have to respect it, take it, and now watch for the buy signals, or something different to emerge from them.

FCEL and BLDP - Play of the Month.


BUY:

FUELCELL ENERGY IN(NasdaqGM: FCEL)

BALLARD POWER SYS(NasdaqGM: BLDP)


Time Frame (3-5 month swing - with profit strategies during this period - stay tuned)


Ballard Power is a weekly technical chart that has come to an inflexion point. This looks the best of the two and shows more symmetry than Fuelcell, which looks as if it trades in more of channel. Also, these are election plays and one of the best sources for the world wide bus market, next to natural gas, but as nat. gas gets more expensive, these type of systems look more attractive for domestic budget issues.

Tuesday, July 1, 2008

1/2 QUAD STRATEGY - Last buy triggered.


The 3rd and last entry point for the 1/2 QUAD strategy would be completed at these levels. The market should bounce as the probabilities are increasing here, but anythings possible.

SLV- BUY. Silver follows Golds lead.

All of this commodity boom is based on shrinkage of Amercian Wealth! What's in your wallet? Bank paper, which is paper backed up by more paper, or something that will never erode like a clunk of silver? For all of the bankers out there, this is the phsycology that is keeping price higher and will continue until we stop the evaporation of Amercian wealth.

Monday, June 30, 2008

GDX- Gold Miners Go Higher.


Junior/Small/Micro caps to outperform Large Cap Gold Stocks.


The market will now discount junior/small/micro caps based on reserves and timeframe to get those reserves - this is partly because if the large caps want to keep up with growth rates, they must start to buy juniors/small/micro cap miners. They have the cash, they just have to do the research and find out which stocks can give them the most octane for their buck.
IVN, CDE, SIL.
P/E (Ratio)

Friday, June 27, 2008

MU - Intraday - Buy Signals


Earlier in the month I said that semiconductors would go into consolidation and one should accumulate. The chart I posted showed the area in which to accumulate, and the price has recently descended beyond the price targets but is at a support line. The intraday charts is oversold and a bounce is due. Pollux Technicals strongly believes this is an area in which to buy MU.

Thursday, June 26, 2008

HSI - HANG SENG revisited.


Let's see if overseas markets can save US markets. Hang Seng(HSI) is consolidating and a possible head and shoulders bottoming pattern could be emerging. If we get a breakdown, look for it to head to the breakdown target where support exists.

DJIA - Entry Points


The 1/3 QUAD strategy would be completed as of today. This would be the 3rd point in which you would re-enter the market.


The 1/2 QUAD strategy is hitting its 2nd entry point today. This is where you would re-enter with capital knowing that you could possibly have a third point of entry soon again.


Look at the indicators - MACD's testing lows soon. RSI is hitting bottom. Fast Stochastic has been dragging for awhile. A bounce is highly-probable.


C - Sell-Stop Warning!

We have to respect that the technicals could deteriorate further giving us a sell-stop warning. Volume is large and if the bounce doesn't occur then more downside risk is ahead. Look at the MACD's which could easily turn down and test that November -3 level.

Recommendation - Sell 1/2 the position and if it breaks down below 17.50 sell the other half and move on for now.


UNG - Throwback in process.


A throwback is occuring. Use this as an opportunity to scoop up cheap stock. Green box is accumulation area.


THROWBACK - A price move back toward the entry level of a security that has broken beyond the barrier of a price pattern or trendline. The retreat toward the level of the breakout is not uncommon and is used by many traders to confirm the validity of the new momentum.

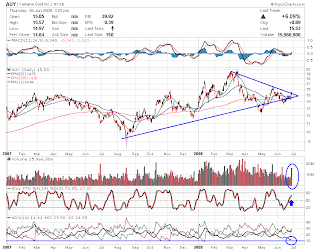
AUY - Triangle Breakout - BUY


Look at the technicals - they are shifting. Gap open today. Momentum is up and fast.

Wednesday, June 25, 2008

FCX and PCU


Positive Technicals for PCU and FCX. Watch for volume to increase for confirmation of more upside trending. Watch copper prices trying to break out of its consolidation for more ammunition to get bigger and longer.


Coal Stocks - MEE, CNX, ACI - Short-Term Negative


Coal Stocks - Short -Term Negative.

Time frame 4-8 weeks, although we saw some of that action occur today, so the time fram may actually be shorter.

Coal stocks have had great runs, and I don't believe the commodity top has burst yet - not by a long shot - but at this point we need the technicals to take a breather and that means corrections are sometimes in order.

I added three charts on MEE, CNX, ACI, and notations of some negatives which would make the case for a short sell. The most bearish going from top to bottom. Pollux Technicals believes this is just a correction that needs to occur in order to support longer term prices. The technicals are looking overbought, but it's waiting for the correction to occur that will be the bigger challenge. These are by no means the long-researched, balance sheet dug type of all out short, but rather a move back to neutral that can be exploited.
Take the profits when they hit - anywhere between 7-10% corrections should be strategically removed - meaning take 2/3 off at the 7-10% correction and another 1/3 off if it hits 10-12% correction.
Stop-Loss Targets:
ACI 77.10
MEE 96.10
CNX 121.10

Monday, June 23, 2008

SIL - Strong Buy


Parallel World.


I would short the first chart and buy the second chart, but the reality is that they are the same chart just flipped - this was done in photoshop. This gives you a context of what it would look like if the price was going the other way.

3 Technicals for the 2nd chart:


RSI hitting bottom and deeply penetrated.
AROON about to shift.
MACD's hitting bottom - which has been a good indicator for a bounce.


BOLLINGER BANDS are showing the stock is oversold and a move back to "normal" 6.44 is due - its the neutrality of the technical mechanism. Also, look how far we have strayed from the Moving Averages. If we live in a parallel universe, and SIL was rising this fast, a short trade would be in order. The prices can not move that far away from MA's - in a normal scenario. The green box is the price target.


Developed by John Bollinger, Bollinger Bands are an indicator that allows users to compare volatility and relative price levels over a period time. The indicator consists of three bands designed to encompass the majority of a security's price action.
A simple moving average in the middle
An upper band (SMA plus 2 standard deviations)
A lower band (SMA minus 2 standard deviations)
Standard deviation is a statistical unit of measure that provides a good assessment of a price plot's volatility. Using the standard deviation ensures that the bands will react quickly to price movements and reflect periods of high and low volatility. Sharp price increases (or decreases), and hence volatility, will lead to a widening of the bands.


Bollinger Band Targets.

1st target $6.44

Second target $8.33

Sunday, June 22, 2008

Copper - Strong Buy


I've been updating charts on copper for some time now - we had an attempt to breakout on copper prices at the beginning of the year, but we quickly sold off from that level, even as copper inventories stayed low. With the recent activity and technical changes, Copper could be once again attempting at the resistance line.


The two charts are different time frames. The longer time frame shows that we could still have prices falling to 325-350 area, but with the technical landscape changing, it is looking less and less likely. The recent action suggests buying from overseas again as the emerging economies are holding up better than the US. As long as Copper inventories stay as low as the charts show, that means, according to Econ 101, that the supply/demand picture supports higher prices.


**Notice the ADX indicator on the shorter time frame which has recently hit bottom - this has shown great buy signals in the past.
I would put a plan into place to go long copper equities, and even start accumulating large portions of the junior miners because their reserves will now start to be noticed by the large caps, even if they are not mining those reserves. The large caps will start to use their cash by gobbling up the juniors and turn those reserves in revenue. We'll look for some juniors this week and post an analysis on a couple.


COW - Livestock Total Return - BUY.


Wouldn't you know it - meat prices are rising.


COW - yes, that's right - is trending higher and everyone wants a piece of it. Volume is increasing substantially here and it has carved itself out since the IPO price. I would look for first resistance at 47 and then the breakout point at 50. The only indicator I'm really looking at here is the MACD's(Moving Average Convergence/Divergence), a stocks momentum, which has shown some positive divergence as is seen with the peeling away of the indicator(Bullish Crossover).


This analysis is truly only a momentum play - a special situation if you will. IPO's have no track record so it can be a dangerous play because if we believe in Technical Analysis - which is the reading of the overall condition of the stocks past performance relative to the future performance, well IPO's don't have any history from which to track. During "mania's" IPO's are nothing more than momentum plays - pure and simple - yes, occasionally you get a GOOG, but for the most part these stocks are meant for short term traders so, buyers beware.