Monday, June 30, 2008

GDX- Gold Miners Go Higher.


Junior/Small/Micro caps to outperform Large Cap Gold Stocks.


The market will now discount junior/small/micro caps based on reserves and timeframe to get those reserves - this is partly because if the large caps want to keep up with growth rates, they must start to buy juniors/small/micro cap miners. They have the cash, they just have to do the research and find out which stocks can give them the most octane for their buck.
IVN, CDE, SIL.
P/E (Ratio)

Friday, June 27, 2008

MU - Intraday - Buy Signals


Earlier in the month I said that semiconductors would go into consolidation and one should accumulate. The chart I posted showed the area in which to accumulate, and the price has recently descended beyond the price targets but is at a support line. The intraday charts is oversold and a bounce is due. Pollux Technicals strongly believes this is an area in which to buy MU.

Thursday, June 26, 2008

HSI - HANG SENG revisited.


Let's see if overseas markets can save US markets. Hang Seng(HSI) is consolidating and a possible head and shoulders bottoming pattern could be emerging. If we get a breakdown, look for it to head to the breakdown target where support exists.

DJIA - Entry Points


The 1/3 QUAD strategy would be completed as of today. This would be the 3rd point in which you would re-enter the market.


The 1/2 QUAD strategy is hitting its 2nd entry point today. This is where you would re-enter with capital knowing that you could possibly have a third point of entry soon again.


Look at the indicators - MACD's testing lows soon. RSI is hitting bottom. Fast Stochastic has been dragging for awhile. A bounce is highly-probable.


C - Sell-Stop Warning!

We have to respect that the technicals could deteriorate further giving us a sell-stop warning. Volume is large and if the bounce doesn't occur then more downside risk is ahead. Look at the MACD's which could easily turn down and test that November -3 level.

Recommendation - Sell 1/2 the position and if it breaks down below 17.50 sell the other half and move on for now.


UNG - Throwback in process.


A throwback is occuring. Use this as an opportunity to scoop up cheap stock. Green box is accumulation area.


THROWBACK - A price move back toward the entry level of a security that has broken beyond the barrier of a price pattern or trendline. The retreat toward the level of the breakout is not uncommon and is used by many traders to confirm the validity of the new momentum.

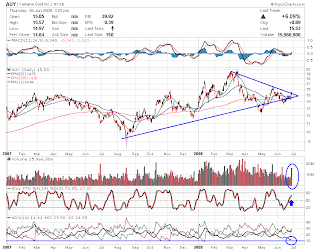
AUY - Triangle Breakout - BUY


Look at the technicals - they are shifting. Gap open today. Momentum is up and fast.

Wednesday, June 25, 2008

FCX and PCU


Positive Technicals for PCU and FCX. Watch for volume to increase for confirmation of more upside trending. Watch copper prices trying to break out of its consolidation for more ammunition to get bigger and longer.


Coal Stocks - MEE, CNX, ACI - Short-Term Negative


Coal Stocks - Short -Term Negative.

Time frame 4-8 weeks, although we saw some of that action occur today, so the time fram may actually be shorter.

Coal stocks have had great runs, and I don't believe the commodity top has burst yet - not by a long shot - but at this point we need the technicals to take a breather and that means corrections are sometimes in order.

I added three charts on MEE, CNX, ACI, and notations of some negatives which would make the case for a short sell. The most bearish going from top to bottom. Pollux Technicals believes this is just a correction that needs to occur in order to support longer term prices. The technicals are looking overbought, but it's waiting for the correction to occur that will be the bigger challenge. These are by no means the long-researched, balance sheet dug type of all out short, but rather a move back to neutral that can be exploited.
Take the profits when they hit - anywhere between 7-10% corrections should be strategically removed - meaning take 2/3 off at the 7-10% correction and another 1/3 off if it hits 10-12% correction.
Stop-Loss Targets:
ACI 77.10
MEE 96.10
CNX 121.10

Monday, June 23, 2008

SIL - Strong Buy


Parallel World.


I would short the first chart and buy the second chart, but the reality is that they are the same chart just flipped - this was done in photoshop. This gives you a context of what it would look like if the price was going the other way.

3 Technicals for the 2nd chart:


RSI hitting bottom and deeply penetrated.
AROON about to shift.
MACD's hitting bottom - which has been a good indicator for a bounce.


BOLLINGER BANDS are showing the stock is oversold and a move back to "normal" 6.44 is due - its the neutrality of the technical mechanism. Also, look how far we have strayed from the Moving Averages. If we live in a parallel universe, and SIL was rising this fast, a short trade would be in order. The prices can not move that far away from MA's - in a normal scenario. The green box is the price target.


Developed by John Bollinger, Bollinger Bands are an indicator that allows users to compare volatility and relative price levels over a period time. The indicator consists of three bands designed to encompass the majority of a security's price action.
A simple moving average in the middle
An upper band (SMA plus 2 standard deviations)
A lower band (SMA minus 2 standard deviations)
Standard deviation is a statistical unit of measure that provides a good assessment of a price plot's volatility. Using the standard deviation ensures that the bands will react quickly to price movements and reflect periods of high and low volatility. Sharp price increases (or decreases), and hence volatility, will lead to a widening of the bands.


Bollinger Band Targets.

1st target $6.44

Second target $8.33

Sunday, June 22, 2008

Copper - Strong Buy


I've been updating charts on copper for some time now - we had an attempt to breakout on copper prices at the beginning of the year, but we quickly sold off from that level, even as copper inventories stayed low. With the recent activity and technical changes, Copper could be once again attempting at the resistance line.


The two charts are different time frames. The longer time frame shows that we could still have prices falling to 325-350 area, but with the technical landscape changing, it is looking less and less likely. The recent action suggests buying from overseas again as the emerging economies are holding up better than the US. As long as Copper inventories stay as low as the charts show, that means, according to Econ 101, that the supply/demand picture supports higher prices.


**Notice the ADX indicator on the shorter time frame which has recently hit bottom - this has shown great buy signals in the past.
I would put a plan into place to go long copper equities, and even start accumulating large portions of the junior miners because their reserves will now start to be noticed by the large caps, even if they are not mining those reserves. The large caps will start to use their cash by gobbling up the juniors and turn those reserves in revenue. We'll look for some juniors this week and post an analysis on a couple.


COW - Livestock Total Return - BUY.


Wouldn't you know it - meat prices are rising.


COW - yes, that's right - is trending higher and everyone wants a piece of it. Volume is increasing substantially here and it has carved itself out since the IPO price. I would look for first resistance at 47 and then the breakout point at 50. The only indicator I'm really looking at here is the MACD's(Moving Average Convergence/Divergence), a stocks momentum, which has shown some positive divergence as is seen with the peeling away of the indicator(Bullish Crossover).


This analysis is truly only a momentum play - a special situation if you will. IPO's have no track record so it can be a dangerous play because if we believe in Technical Analysis - which is the reading of the overall condition of the stocks past performance relative to the future performance, well IPO's don't have any history from which to track. During "mania's" IPO's are nothing more than momentum plays - pure and simple - yes, occasionally you get a GOOG, but for the most part these stocks are meant for short term traders so, buyers beware.


Friday, June 20, 2008

KKD - The move that was.


I first posted about Krispy Kreme KKD on my stockharts page in January and said that this was one to accumulate- there were even times you could accumulate KKD for under $3 dollars.
I recently posted a buy recommendation for KKD on June 10th and since then it has run 65% to a recent high of 5.60. The Tehcnicals were there and the propabilities were also - the MA's were crossing, teh resistance line was being breached, the RSI bounced on 50 and the Money Flows were extremely in favor of demand for the stock.
I will recommend selling 2/3 of KKD here and letting go of the last 1/3 if prices move towards the resistance line, possibly even pulling a Doji Star into the resistance area. Overall the technicals spoke - the market listened - or was it vice versus? I'll let you decide.


DRAM pricing turns down - Semis go into consolidation.

Inter-Market analysis says that semi's are in consolidation for summer. Front end of pricing has turned down as the link below will show. Pollux Technicals believes this is only a short-term stance as the consolidation of competition continues and the over-built supply/demand issues continue to play out. Long Term (3-5yrs) the semiconductor industry remains an overweight.

http://www.dramexchange.com/watch/price_index_main_new.asp

Thursday, June 19, 2008

VIX at resistance - Markets likely to bounce.


In May I did a piece on the VIX vs DJIA which has played out quite nicely. If we look back we can see that the VIX bounced on support of 17.5 and the DJIA hit resticance area at the same time - a good calculated place to change portfolio stance. We put a strategic plan in place to accumulate cheap stock according to the QUAD strategies that Pollux Technicals created in its earlier post.
According to the charts, we can see something is happening again with VIX at resistance while the Dow Jones Industrial average is at 1st support of the 1/2 QUAD strategy. This is the first point where one would buy stocks according to the 1/2 QUAD(more bearish). According to the 1/3 QUAD(more bullish) it would be the 2nd point where one would buy stock. All in all, a market bounce is likely here according to the VIX which has been a good indicator for this meandering market correction.

Platinum


Platinum has broken out of its channel range and possibly going into what Goldman Sachs would term a "super cycle". Look for the metal to continue to outperform its peers, especially due to the supply concerns again.
There is recent article on the affects of Platinum price and US auto sales that I believe again misrepresents the dynamic forces moving prices.
The fact is that auto sales and growth aren't in the US. The growth continues to come from emerging markets, although it will come in the smaller, lower margined car markets, thus creating the demand for platinum, and all other commodites, no matter what the US is doing with it's auto, or any other purchasing in general. When these shifts change the first conclusion is most often the wrong conclusion, so with people focusing on the muddled US economy when looking at commodity pricing - most likely they are not seeing the true landscape, especially with what has happened to OIL despite the slow US economy. The rise of commodity prices is a byproduct of worldly demand-pull inflation, thereby creating rising prices for the US economy while were in the midst of major changes to our financial system. This also leads to stagflation as the credit woes deteriorate our wealth factors - but were not going to try and become economists, were just going to analyze the charts.
SWC - Stillwater mining will be a major beneficiary of any swings in price and with the last run at the beginning of the year, and after a consolidation, SWC has triggered a buy signal.

Palladium


Palladium has consolidated since its run to 600 on supply concerns out of South Africa - a pennant is now forming which shows a near term run to 600 is evident. As production continues to decrease, the price will continue to increase. Palladium has many uses, but the main use is in catalytic converters which are an environmental necessity on all cars in the US, and again as the demand continues to come from overseas, and as emerging economies modernize, envrionmental standards will change and be another catalyst for continued demand. The supply/demand picture favors higher prices and the technicals back this thesis up.

Friday, June 13, 2008

Citigroup - 3 ways to play


Three ways to play Citigroup from a technical standpoint:

Scalp trade: sell at the dotted line - buy again when it corrects - but you have to be extremely fast.

Swing Trade: sell at the the solid line - wait for pull back to the dotted line and buy again.

Long Term Trade: take the 5% dividend and believe that C will trade in the 30's at the end of 09.

Citigroup's technicals are showing signs of improving. The RSI is near the bottom range, although we have not seen it cross below 30 to create a colorful and more convincing penetration: this is why you would start averaging into it here to be sure you are in the game, but your not the only one on the court.

Also, the Money Flow has started to show positive divergence and the volume is increasing here on the right side of the potential double bottom.

The MACD's have been carving itself out below the neutral line with a postive bias since the October plunge, with a penetration recently to +1, and now a retracement to -1. Remember, that right there is parallel divergence - a run back to 0 should be in order.

Sell stop at 17.5 to enable risk management.

Tuesday, June 10, 2008

As sweet as Krispy Kreme.


As the restructuring continues, the technicals improve.LT Bottom could be in place.

Micron - MU - Accumulate.


Technicals:

-AROON popped showing the correction is now here and accumulation is evident.
-MA's are showing the support/resistance zones.
-Double Bottom
-MACD's testing neutral


Micron has pulled back after double bottoming and running from 5.5 to almost 9 dollars. This recent retracement will take some time, but this is where one should be accumulating. Semiconductors will lead the technology recovery(see blog post "The Other Commodity"). I also have included the DRAM pricing with MU because the semi's are nothing more than a commodity, but rather than it be a commodity of nature, it's a commodity of "humanity" - meaning it's a byproduct of our human intelligence and the initialization into the technological world we will continue to advance into. DRAM prices are stable, and are slightly trending higher.


http://www.dramexchange.com/watch/price_index_main_new.asp


The correlation between stock price and commodity price is real, so watch for this correlated relationship, but MU is for sure a continued accumulation as Pollux Technicals believes the next great bull is in Semiconductors.

Trading Dryships - BUY


Things to consider unrelated to Technical Analysis:


- Shipping Rates
- Merchant Shipping Capacity
- Dow Theory(transports) - Shipping is the global equivalent.


This one is a beautiful looking chart that has many great technicals that are easy to identify. We recently bought DRYS at 60 - near the end of the triangle in the first chart - and sold it incrementally on its way to 110. Sold 1/3 at 85, 1/3 at 95 and the last1/3 at 110. As it drifted to 115 and near the resistance from the peak of October, we went short because of the technical divergences and have now covered all short positions.


Now DRYS is pulling a great technical shift again. Let's look at the MACD's on the 2nd chart near the neutral line, in which will test if the trend can continue upwards. The AROON recenly popped negative which sometimes indicates a lagging market, or another words, the selling is now nearing an end. The entry point is where the technicals could shift, and also look at the MA's which is where major support exists.


We will place a sell-stop at around 68 which is well below where the stock is now, but this is the risk management portion of what a good trader will always keep in mind. At these levels, DRYS is a buy.


Tuesday, June 3, 2008

UNG - Breakout


Technical Breakout! - We need confirmation on volume and a move towards the 60, but the UNG does look poised for upward trending. Natural Gas seems to be less lofty than oil and makes for a good alternative that can really eat away at Oils market share.